Creating spectroscopic look-up tables
ArchNEMESIS includes functionality to create line-by-line or correlated-k look-up tables compatible with both archNEMESIS and NEMESIS. These programs are based on the spectroscopic calculations made with the LineData class, so we also encourage the users to also explore this tutorial to better understand how the calculations are performed.
In this notebook, we provide some examples showing how archNEMESIS can be used to create these look-up tables.
[1]:
import archnemesis as ans
import matplotlib.pyplot as plt
import numpy as np
from archnemesis.Data.path_data import archnemesis_path
1. Creating a line-by-line look-up table
We are going to create a look-up table for the main isotope of CO (ID=5, ISO=1) using spectroscopic line data from HITRAN2024, together with the partition sums from TIPS2025.
The main function for creating these look-up tables is called calc_lbltable() and is stored in the Spectroscopy_0.py file. A description of the input parameters is defined below:
[2]:
help(ans.calc_lbltable)
Help on function calc_lbltable in module archnemesis.Spectroscopy_0:

calc_lbltable(outname, gasID, isoID, npress, p0, pn, ntemp, t0, tn, ispace, nwave, wavemin, delwave, iproc, wn_calc_window, wn_approx_window, self_frac, line_database, pf_database='/home/alday/Documents/Projects/archnemesis-dist/archnemesis/Data/partition_functions/tips2025.h5', cont_database=None, include_pressure_shift=True)
    Calculate a line-by-line look-up table for a given gas
    at specified pressure and temperature levels

    Input parameters
    -----------------
    @param gasID: int
        Nemesis gas identifier
    @param isoID: int
        Nemesis isotopologue identifier
    @param npress: int
        Number of pressure levels
    @param p0: float
        Minimum pressure level (atm)
    @param pn: float
        Maximum pressure level (atm)
    @param ntemp: int
        Number of temperature levels
    @param t0: float
        Minimum temperature level (K)
    @param tn: float
        Maximum temperature level (K)
    @param ispace: int
        Spectral unit (0 - wavenumbers (cm-1); 1 - wavelength (um))
    @param nwave: int
        Number of wavenumber/wavelength points
    @param wavemin: float
        Minimum wavenumber/wavelength (cm-1/um)
    @param delwave: float
        Wavenumber/wavelength step (cm-1/um)
    @param iproc: int
        Lineshape identifier (see possible cases in SpectroscopicLineProfileEnum)
    @param wn_calc_window: float
        Wavenumber window for lineshape calculation (cm-1)
    @param wn_calc_window: float
        Wavenumber window for lineshape wing approximation (cm-1)
    @param self_frac: float
        Self-broadening fraction (0 - complete self-broadening, 1 - complete air broadening)
    @param line_database: str
        Path to archnemesis spectroscopic database to use ('HITRAN','GEISA', etc.)
    @param pf_database: str
        Path to archnemesis partition function database (default = TIPS2025)
    @param cont_database: str
        Path to archnemesis pseudo-continuum database (default = None). If None, it is assumed
        it is the same as the line_database
    @param include_pressure_shift: bool
        If True, include pressure shift in the waveumber of the lines
[20]:
#lbl-table inputs
################################################################################

#CO
gasID = 5 ; isoID = 1
outname = "example_co"

npress = 10 ; p0 = 1.0e-6 ; pn = 1.0e-2
ntemp = 10 ; t0 = 130. ; tn = 250.

ispace = 0   #wavenumber (cm-1)
vmin = 2050. ; delv = 0.001 ; nwave = 12001

iproc = 0             #Voigt lineshape
wn_calc_window = 25.  #Caclculation window (cm-1)
wn_approx_window = 75.  #Caclculation window (cm-1)
self_frac = 0.5       #fraction of self-broadening

line_base = archnemesis_path()+"/tests/files/linedata/CO_1_ambient_AIR.h5"
pf_base = archnemesis_path()+'/archnemesis/Data/partition_functions/tips2025.h5'

#Performing calculations
###################################################################################

#Calculating lbl-table
ans.calc_lbltable(outname,                       #Name of the output .lta file
                  gasID,isoID,                   #Gas information
                  npress,p0,pn,                  #Pressure grid
                  ntemp,t0,tn,                   #Temperature grid
                  ispace,nwave,vmin,delv,        #Wavenumber grid
                  iproc,                         #Lineshape identifier
                  wn_calc_window,                #Wavenumber calculation window (cm-1)
                  wn_approx_window,              #Wavenumber window at which an approximation for the wings is applied (cm-1)
                  self_frac,                     #Self-broadening fraction
                  line_base,                     #Database
                  pf_database=pf_base,           #Partition function database (default = TIPS2025)
                  cont_database=None,            #Pseudo-continuum database (If not None, it will use the same as the line_database)
                  include_pressure_shift=True,   #Flag to include pressure shift in the waveumbers
)
INFO :: read_tables :: Spectroscopy_0.py-1467 :: Reading tables
INFO :: read_tables :: Spectroscopy_0.py-1474 :: RUNTIME calculation is loading desired wavenumber range from databases
INFO :: read_tables :: Spectroscopy_0.py-1480 :: Reading table self.LOCATION_LD[igas]='/home/alday/Documents/Projects/archnemesis-dist/tests/files/linedata/CO_1_ambient_AIR.h5' wavemin=2050.0 wavemax=2062.0
INFO :: calc_klbl_online :: Spectroscopy_0.py-2113 :: Gas 5, Isotope 1 - Calculating line-by-line cross sections at runtime...
INFO :: calc_klbl_online :: Spectroscopy_0.py-2113 :: Gas 5, Isotope 1 - Calculating line-by-line cross sections at runtime...
LineData_0::fetch_partition_fn()
Actually getting the partition function
LineData_0::fetch_partition_fn()
Actually getting the partition function
INFO :: calc_klbl_online :: Spectroscopy_0.py-2113 :: Gas 5, Isotope 1 - Calculating line-by-line cross sections at runtime...
INFO :: calc_klbl_online :: Spectroscopy_0.py-2113 :: Gas 5, Isotope 1 - Calculating line-by-line cross sections at runtime...
INFO :: calc_klbl_online :: Spectroscopy_0.py-2113 :: Gas 5, Isotope 1 - Calculating line-by-line cross sections at runtime...
INFO :: calc_klbl_online :: Spectroscopy_0.py-2113 :: Gas 5, Isotope 1 - Calculating line-by-line cross sections at runtime...
INFO :: calc_klbl_online :: Spectroscopy_0.py-2113 :: Gas 5, Isotope 1 - Calculating line-by-line cross sections at runtime...
INFO :: calc_klbl_online :: Spectroscopy_0.py-2113 :: Gas 5, Isotope 1 - Calculating line-by-line cross sections at runtime...
INFO :: calc_klbl_online :: Spectroscopy_0.py-2113 :: Gas 5, Isotope 1 - Calculating line-by-line cross sections at runtime...
INFO :: calc_klbl_online :: Spectroscopy_0.py-2113 :: Gas 5, Isotope 1 - Calculating line-by-line cross sections at runtime...
[21]:
#Reading the table
#Initialising spectroscopy class with ILBL = 2 (line-by-line)
Spectroscopy = ans.Spectroscopy_0(ILBL=2)

Spectroscopy.NGAS = 1  #We define two gases in the class
Spectroscopy.LOCATION = [outname+'.lta']

#Reading the header information
Spectroscopy.read_header()

#Printing summary information
Spectroscopy.summary_info()
WARNING :: read_header :: Spectroscopy_0.py-1281 :: self.NGAS=1 self.LOCATION=PathRedirectList(['example_co.lta'], redirects = {})
INFO :: summary_info :: Spectroscopy_0.py-461 ::
#===== SUMMARY =====#
        Spectroscopy_0 instance at memory location 138921419979216
        Calculation type ILBL ::  (<SpectralCalculationModeEnum.LINE_BY_LINE_TABLES: 2>, ' (line-by-line)')
        Number of radiatively-active gaseous species ::  1
        Gaseous species ::  ['CO (1)']
        Number of spectral points ::  12001
        Wavelength range ::  (np.float64(2050.0), '-', np.float64(2062.0))
        Step size ::  0.0010000000002037268
        Number of temperature levels ::  10
        Temperature range ::  (np.float32(130.0), '-', np.float32(250.0))
        Number of pressure levels ::  10
        Pressure range ::  (np.float32(1e-06), '-', np.float32(0.01))
#===================#
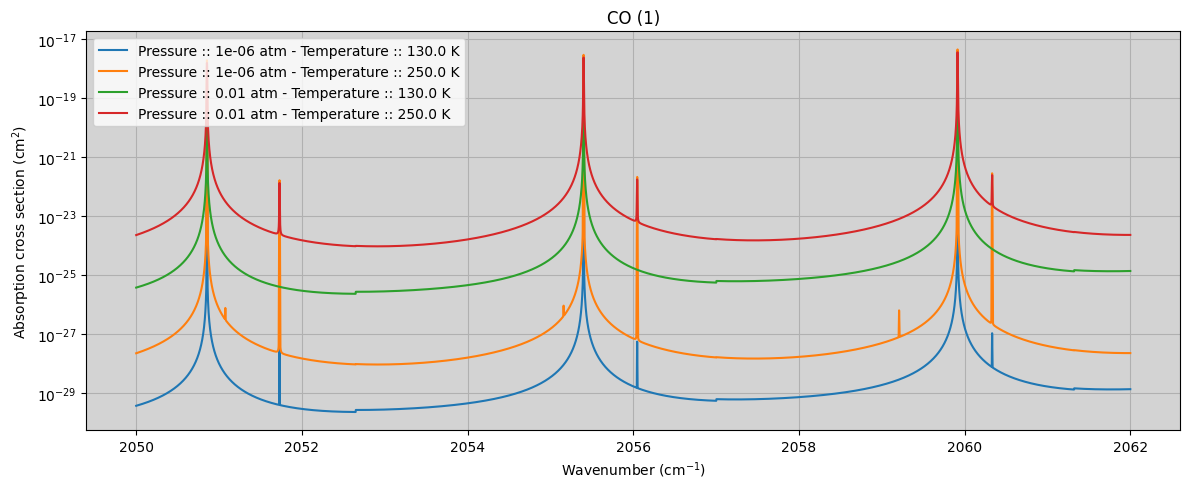
[22]:
#Reading the information in the lbl-tables in a specified spectral range
Spectroscopy.read_tables()

fig,(ax) = plt.subplots(Spectroscopy.NGAS,1,figsize=(12,5),sharex=True)


ipress = 0 ; itemp = 0
ax.plot(Spectroscopy.WAVE,Spectroscopy.K[:,ipress,itemp,0],label='Pressure :: '+str(Spectroscopy.PRESS[ipress])+' atm - Temperature :: '+str(Spectroscopy.TEMP[itemp])+' K')

ipress = 0 ; itemp = -1
ax.plot(Spectroscopy.WAVE,Spectroscopy.K[:,ipress,itemp,0],label='Pressure :: '+str(Spectroscopy.PRESS[ipress])+' atm - Temperature :: '+str(Spectroscopy.TEMP[itemp])+' K')

ipress = -1 ; itemp = 0
ax.plot(Spectroscopy.WAVE,Spectroscopy.K[:,ipress,itemp,0],label='Pressure :: '+str(Spectroscopy.PRESS[ipress])+' atm - Temperature :: '+str(Spectroscopy.TEMP[itemp])+' K')

ipress = -1 ; itemp = -1
ax.plot(Spectroscopy.WAVE,Spectroscopy.K[:,ipress,itemp,0],label='Pressure :: '+str(Spectroscopy.PRESS[ipress])+' atm - Temperature :: '+str(Spectroscopy.TEMP[itemp])+' K')


ax.set_yscale('log')
ax.set_ylabel('Absorption cross section (cm$^2$)')
ax.set_title(gasname[i])
ax.legend()
ax.grid()
ax.set_facecolor('lightgray')
ax.set_xlabel('Wavenumber (cm$^{-1}$)')
plt.tight_layout()
INFO :: read_tables :: Spectroscopy_0.py-1467 :: Reading tables
INFO :: read_tables :: Spectroscopy_0.py-1524 :: Reading table self.LOCATION[igas]='example_co.lta' wavemin=0.0 wavemax=10000000000.0